In today’s data-driven business environment, organizations need to efficiently manage and share data reports to make informed decisions quickly. Power BI Service is a powerful tool that can help businesses achieve this. However, many organizations design Power BI workspaces without a clear concept of planning and permission management. In this article, we’ll use a workspace architecture diagram as an example to explore how to plan a Power BI Service workspace so that IT staff and departments can collaborate effectively.

1. The basic concept of a workspace
Power BI Service’s workspace is a logical container for organizing and managing reports, datasets, dashboards, and more. Each workspace can be set with different permissions to control who can view and edit content within it. In general, workspaces should be designed with the following aspects in mind:
- User roles: Who needs to view the report? Who needs to edit the report?
- Data security: How do you ensure that sensitive data is not accessed by unauthorized users?
2. Design ideas for architecture diagrams
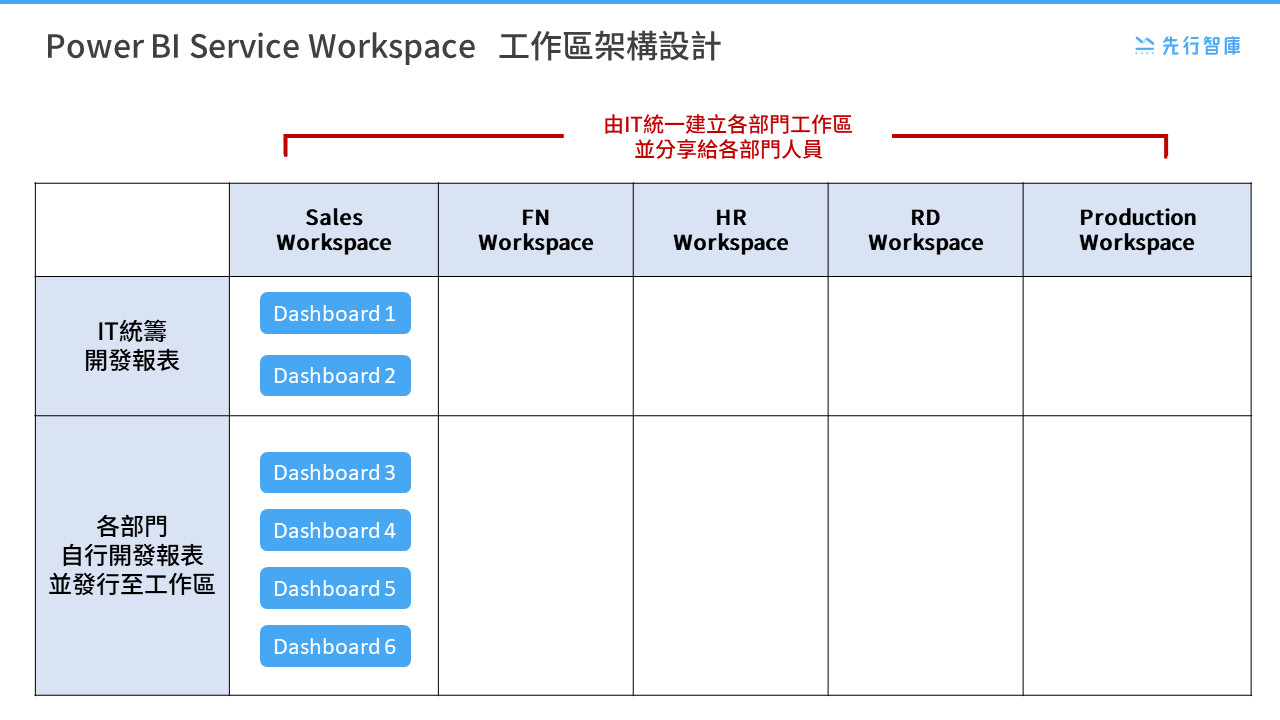
In this architecture diagram, we can see that different departments (e.g. Sales, FN, HR, RD, Production) have their own work areas. The IT department establishes these workspaces in a unified manner and shares them with the personnel of various departments. This design helps to ensure the uniformity and security of data, and at the same time facilitates the development and management of reports according to the needs of each department.

3. IT unified development reports and self-developed reports by each department
There are two types of reports shown in the architecture diagram:
- IT unified development reports: These reports are developed and maintained by the IT department, and are suitable for standardized reports that need to be used across departments. For example, in Sales Workspace, the IT department developed Dashboard 1 and Dashboard 2. These reports ensure data consistency and accuracy.
- Each department can develop and publish reports to its own workspace according to its own business needs. For example, in Sales Workspace, the department developed Dashboards 3, 4, 5, and 6 on their own. This flexible approach can meet the individual needs of various departments and improve the efficiency of report development.
4. Authority
Permissions management is a critical part of the Power BI workspace design. Each workspace should have different permission levels to control which users can view and edit the report. In this architecture diagram, you can set permissions based on the following principles:
- View permission: allows users to view report data only and is applicable to common business users.
- Edit permissions: Allows users to edit and publish reports, for report developers and business analysts.
- Manage permissions: Allows users to manage all content and permission settings for the workspace and is available for IT managers.
- Such permission settings ensure the security of the data and prevent unauthorized modification and data leakage.

Conclusion
By properly planning the workspace architecture of Power BI Service, enterprises can achieve efficient report management and data collaboration. The architecture diagram shown in this article provides a clear example of how IT departments can collaborate with departments through unified development and rights management. Hopefully, these recommendations and case studies will help businesses make better use of Power BI Service to improve data management and decision-making.
KSCC is a management consulting company in Taiwan. Our services include corporate in-house training, consulting, and leadership management.For more information about our corporate services, please feel free to visit our website: https://kscthinktank.com.tw/custom-training/
