掌握即時數據!簡單5步驟教你設定 Power BI 儀表板最後刷新時間

5 simple steps to set the last time your Power BI dashboard is refreshed!Get your hands on real-time data

Power BI Service doesn’t directly display when the dashboard was last refreshed, and can only confirm the refresh date from the workspace or from the lower-right corner of the dashboard, but this incomplete information makes it difficult for readers to confirm the latest status and accuracy of the report data.

5 simple steps to set the last time your Power BI dashboard is refreshed!Get your hands on real-time data Read More »

掌握即時數據!簡單5步驟教你設定 Power BI 儀表板最後刷新時間

掌握即時數據!簡單5步驟教你設定 Power BI 儀表板最後刷新時間

Power BI Service 並不能直接顯示儀表板最後刷新時間,僅能從工作區或儀表板右下角確認刷新日期,但這些不完整的資訊使得閱讀者難以確認報表數據的最新狀態與準確性。為了解決這個問題,本篇文章將教你如何透過簡單的公式,在儀表板中呈現最後的刷新時間,確保讀者能掌握數據的即時性,進一步提升報表的可靠性和使用體驗。

掌握即時數據!簡單5步驟教你設定 Power BI 儀表板最後刷新時間 Read More »

No matter how many pie charts are classified, you are not afraid of dazzle! Use Power BI to display the top N items to make the layout no longer crowded

In data visualization, pie charts are a common and intuitive tool for showing proportional relationships between different categories. However, when there are many categorical items in a dataset, pie charts can become too complex to read. This situation will not only confuse the report reader, but may even affect the interpretation of the data.

No matter how many pie charts are classified, you are not afraid of dazzle! Use Power BI to display the top N items to make the layout no longer crowded Read More »

Power BI field parameter feature allows you to flexibly switch between multiple analysis perspectives in charts

Power BI field parameter feature allows you to flexibly switch between multiple analysis perspectives in charts

the Power BI field parameter feature not only greatly improves the readability of report readers, but also allows report makers to save a lot of time in developing charts. The flexible filtering of Power BI field parameters makes our dashboards even more concise.

Power BI field parameter feature allows you to flexibly switch between multiple analysis perspectives in charts Read More »

Can you use Excel to implement web crawling ChatGPT helps you quickly write VBA and automatically scrape5

Can you use Excel to implement web crawling? ChatGPT helps you quickly write VBA and automatically scrape website data

today’s data collection is no longer just the preserve of programmers – even if you are just a daily Excel user, or even a novice programmer, you can use Excel’s VBA feature to implement web crawling. And all of this can be easily done with the assistance of ChatGPT.

Can you use Excel to implement web crawling? ChatGPT helps you quickly write VBA and automatically scrape website data Read More »

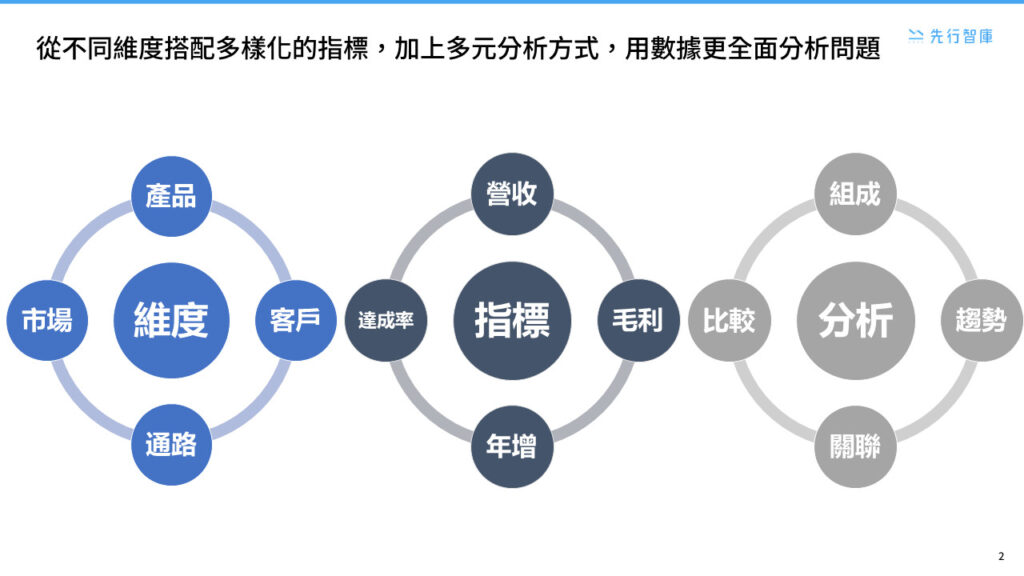
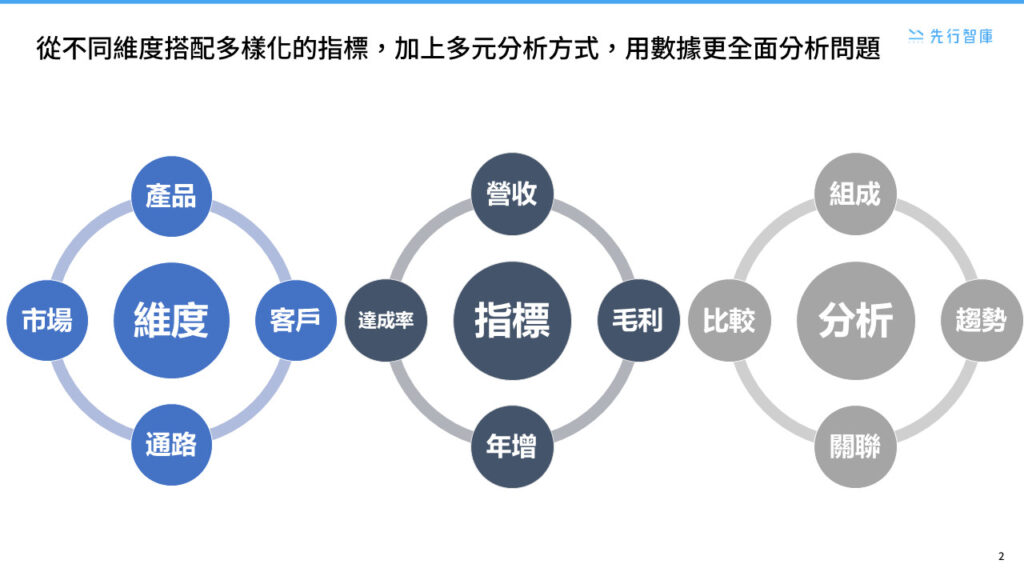
What is the Holistic Data Analysis Method4

什麼是「全局觀數據問題分析法」?3大優勢讓你突破思考盲點!

不少人在面對數據時,常陷入「見樹不見林」的困境,僅憑單一指標或局部現象就妄下結論,導致決策失誤。想要突破思考盲點,就必須培養「全局觀數據問題分析法」,從多維度、多指標、多角度全面剖析問題,才能做出更精準的判斷。

什麼是「全局觀數據問題分析法」?3大優勢讓你突破思考盲點! Read More »

Scroll to Top
取得最新資訊

訂閱每週最新消息