
In the pharmaceutical industry, business units often pay attention to sales data to ensure that performance targets are met. However, the business analysis of many pharmaceutical companies is still at the surface level, focusing on indicators such as sales compliance rate, product performance of hospitals, or sales amount and product count.
Although these data can reflect the performance, most of them are lagging indicators, and it is difficult to provide forward-looking decision-making support. As the market becomes more competitive, business units need to dig deeper into data and grasp key drivers to predict trends, optimize sales strategies, and truly improve market competitiveness.
How did we analyze the order data of pharmaceutical companies in the past?
In the traditional business data analysis of pharmaceutical companies, the business personnel mainly focus on the sales amount, compliance rate and product count, and use these data as the main indicators for performance evaluation. However, there are a number of pain points associated with this type of analysis:
- Poor data integration:
Due to the limitations of the Excel tool, we usually only analyze data from a single angle, such as business sales figures, or customer satisfaction. It’s a big job to cross-compare multiple data sources with performance figures. - Relying too much on the end result and not looking at the process or impact:
Focus only on the amount of sales and ignore the antecedents that affect performance, such as customer engagement and satisfaction. - Inability to accurately assess business performance:
The performance attainment rate does not equal the level of effort, and it is difficult to fairly measure the contribution of business representatives.

Integrate data from all three sources to improve the quality and accuracy of analysis
In order to analyze the business performance of pharmaceutical companies more accurately, we should integrate performance data, call number, and customer satisfaction data to provide a more comprehensive analysis:
- Performance data:
It’s still a core metric, but it should be combined with other data to avoid relying solely on sales amounts. - Call number:
Track rep interactions with doctors or hospitals to find out how many calls correlate with performance. If the number of calls increases but the performance does not, it may indicate that the communication strategy needs to be adjusted. - Customer satisfaction:
Collect data through questionnaires, return visit records or other channels. A drop in satisfaction could mean a problem with a product, service, or business interaction.
Through the cross-analysis of these three big data, we are able to more accurately evaluate the performance of business representatives and identify the key factors that affect performance.

How do you analyze data from three new dimensions?
In order to have a deeper understanding of performance, we can analyze it from the following perspectives:
- The correlation between performance and call number:
If a rep has a high call count but isn’t growing in tandem, it may be necessary to review whether the communications are effective.
- The correlation between performance and customer satisfaction:
If performance increases but satisfaction decreases, it may affect the long-term relationship, and the strategy should be adjusted early.
- Comparison of the performance of different business representatives:
By analyzing the number of calls, performance and customer satisfaction of each sales representative, we can find out the success model of high-performing personnel and promote it to the whole team.
Use Power BI to cross-analyze multi-dimensional sales data of pharmaceutical companies
Let’s look at the following examples. We can put together trends in performance, number of calls, customer satisfaction, and see how relevant they are.
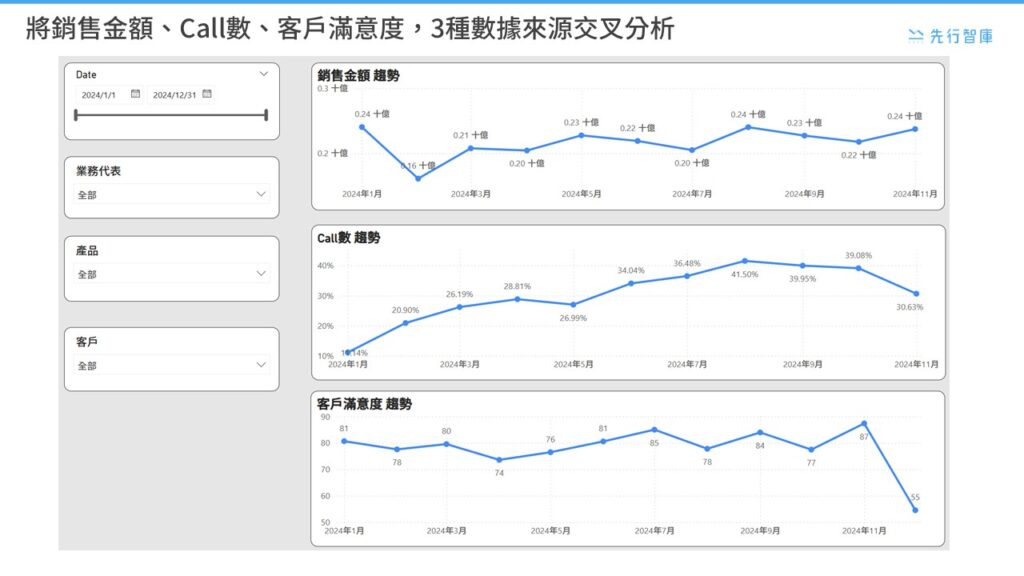
From the above diagram, we can draw the following conclusions
- The fluctuation of the sales amount is not exactly synchronized with the change in the number of calls:
The number of calls showed a gradual upward trend throughout the year, especially peaking at 41.50% from July to September, but the sales amount did not increase significantly. This shows that the number of calls alone is not the decisive factor, but that other variables such as customer satisfaction, product strategy, or market demand need to be considered. In addition, the number of calls in November decreased significantly (30.63%), but the sales amount remained at a relatively high point (0.24 billion), which may indicate that the decrease in the number of calls did not immediately affect the performance, or the market demand has been relatively stable, so that the change in the number of calls has little impact. - The number of calls in January fell in tandem with satisfaction, which could be a sign of a decline in future performance:
The drop in call numbers in November coincided with a sharp drop in customer satisfaction (from 87 to 55), which could hint at several scenarios. Reduced business activity leads to lower customer satisfaction, which may be due to reduced interaction with medical representatives, impacting customer relationships. Or there are other competing products or price changes in the market, resulting in a decrease in customer interest in an existing product. It could even be that internal issues, such as supply chain issues or policy adjustments, are impacting a customer’s purchasing decision or experience.

Conclusion
In the above example, three data sources are integrated, and it would take a lot of time to use traditional Excel. However, with Power BI, not only can you quickly integrate multiple data sources, but you can even analyze them from different dimensions. For example, we can even look at the correlation between the three from the perspective of a single business, the correlation between the three from the perspective of the product, and even the correlation between the three from the perspective of a single customer. Through such a data analysis framework, pharmaceutical companies can not only improve sales performance, but also optimize business strategies in a more proactive way to ensure market competitiveness.
KSCC is a management consulting company in Taiwan. Our services include corporate in-house training, consulting, and leadership management.For more information about our corporate services, please feel free to visit our website: https://kscthinktank.com.tw/custom-training/