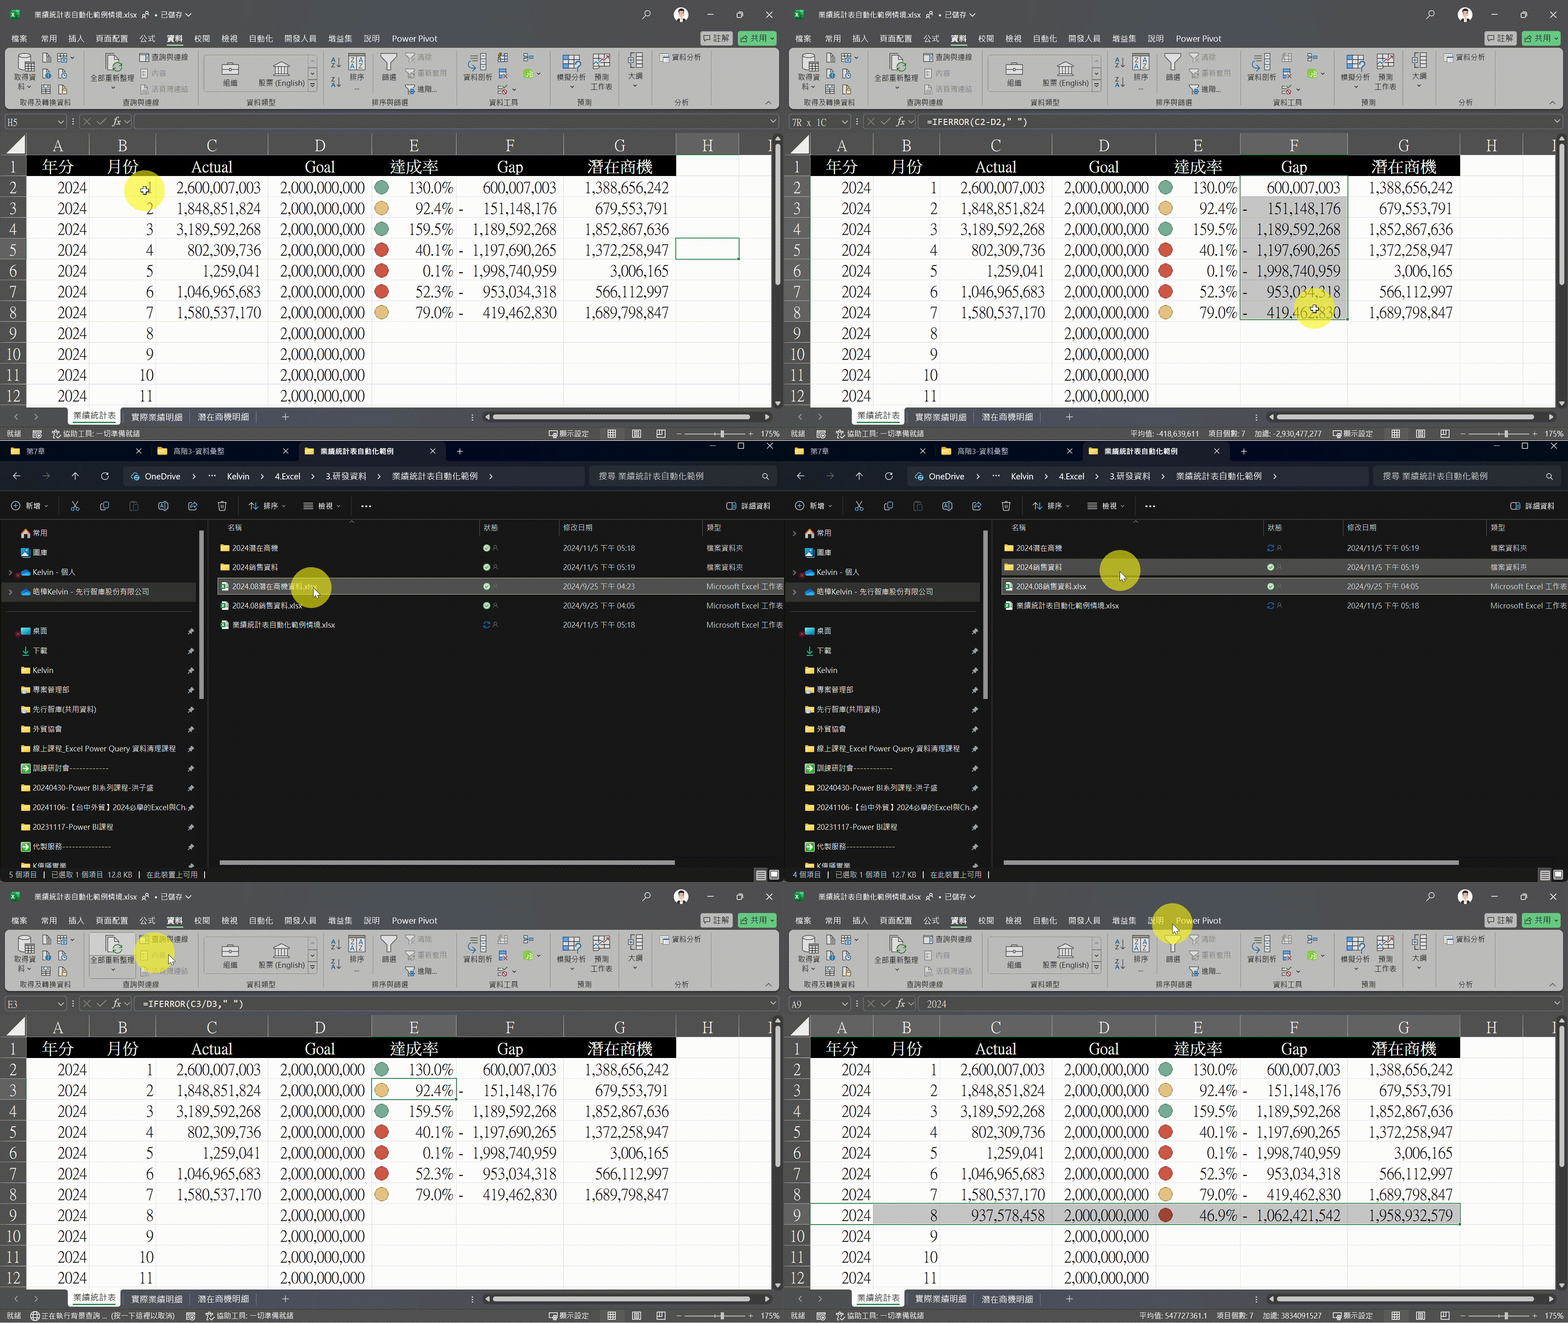
▲ This article will show you how to easily automate your annual performance report
1、Introduction
Updating weekly or monthly Excel reports often requires manually adjusting formats, deleting blank spaces, and correcting data errors—an exhausting and error-prone process. Many professionals consider learning VBA for automation, but programming has a steep learning curve and a small mistake can crash Excel, making it more trouble than it’s worth.
Fortunately, Excel’s built-in Power Query can handle these repetitive and tedious tasks effortlessly! With a one-time setup, Power Query can automatically clean data, calculate performance achievement rates, and merge reports—completely eliminating manual processing.
In this article, we’ll walk you through automating an Annual Performance Achievement Report using Power Query. After setting it up, all you need to do is drop new data into a designated folder, and the report will generate instantly. This approach not only makes your Excel reports smarter but also significantly improves efficiency while ensuring data accuracy!
2、What is Power Query?
(Power Query is available in Excel 2016 and later versions.)
Power Query is Excel’s built-in ETL (Extract, Transform, Load) tool, designed to process, clean, and transform data. It helps users automate repetitive data processing tasks, including:
- Importing external data
- Cleaning and reformatting datasets
- Merging multiple reports
- Filtering and transforming data
By using Power Query, Excel reports can be updated in real time without manual intervention. Next, we’ll demonstrate how to automate an Annual Performance Achievement Report, showing how Power Query can streamline data processing and ensure your reports remain up to date, making your Excel workflow more efficient and professional.
3、Automating the Performance Achievement Report
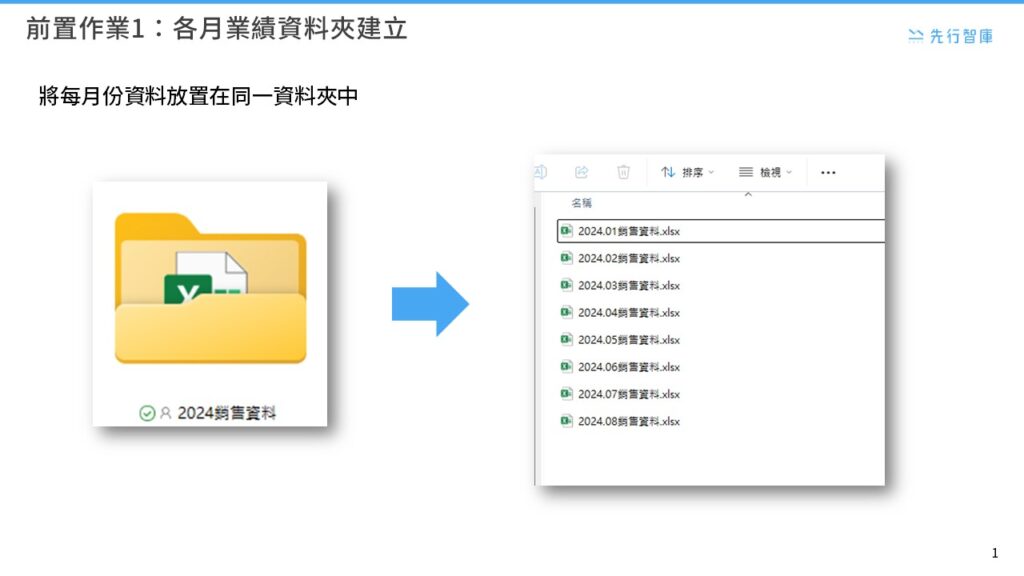
Preparation Step 1: Organize Your Data Sources Before automating the annual performance report, ensure your data sources are structured consistently so Power Query can read and integrate them correctly. Create a dedicated folder to store all monthly Excel files in one place.
Preparation Step 2: Convert Data into a Formatted Table
Convert each dataset into an Excel Table (Ribbon → “Format as Table”) and assign a uniform table name (e.g., Y24M) across all files. This step ensures Power Query can correctly recognize and process the data.

Step 1: Import Data for an Automated Performance Report
In Excel, use Power Query to import all Excel files from the folder, ensuring real-time updates without manual data merging.
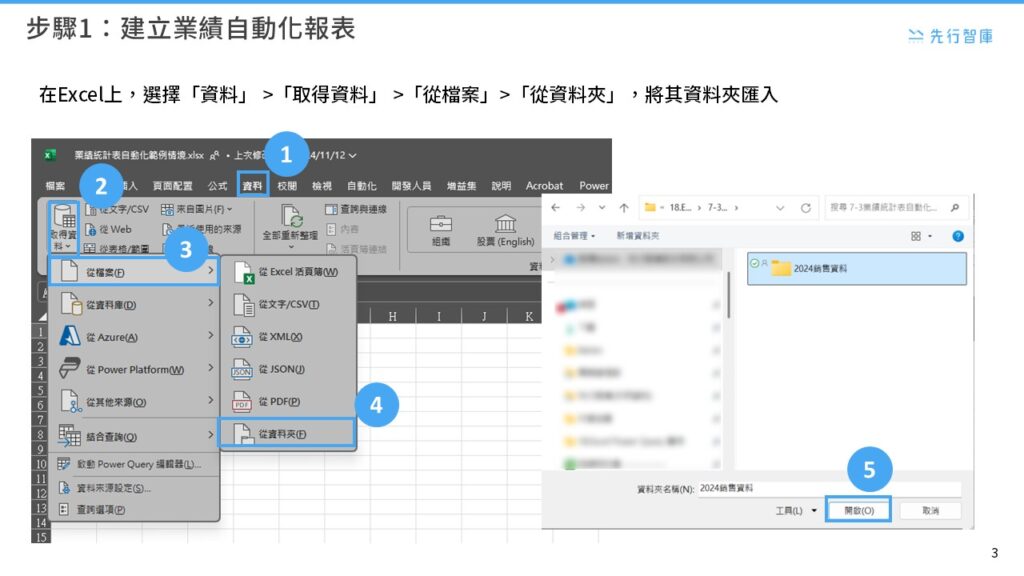
- Open Excel and go to the Data tab.
- Click Get Data → From File → From Folder to activate Power Query’s import function.
- Select the folder containing all performance data files (e.g., 2024 Sales Data) and click Open.
Step 2: Merge Files in Power Query
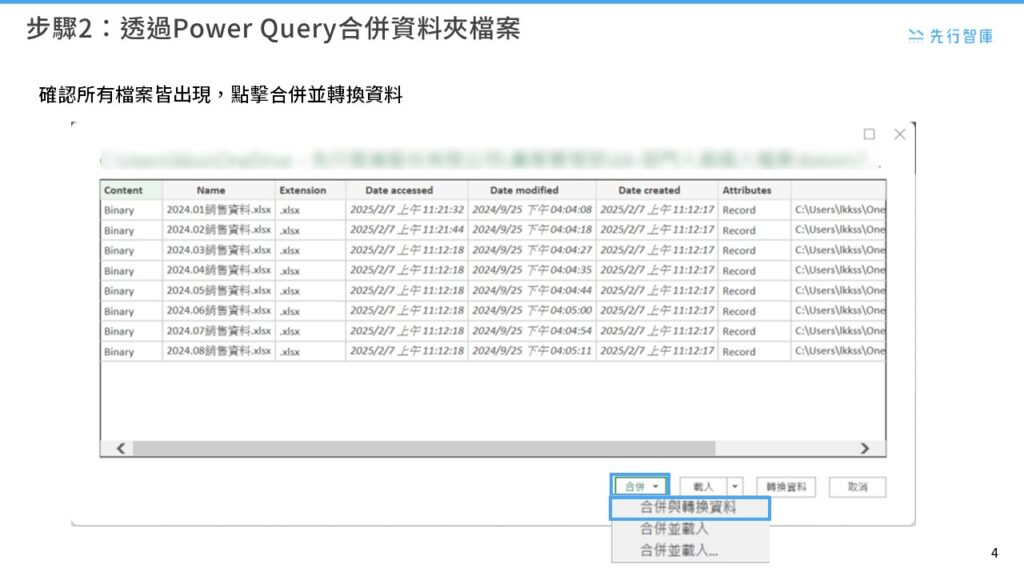
Once Power Query loads the folder, it will display a list of all Excel files. Verify that all months are correctly listed, then:
- Click Combine → Combine & Transform Data.
- Power Query will automatically merge the contents of all files into a master dataset.
- The editor mode will open, allowing further data cleaning and column formatting.
- This step consolidates data from different months into a unified report source, eliminating manual errors and saving time.
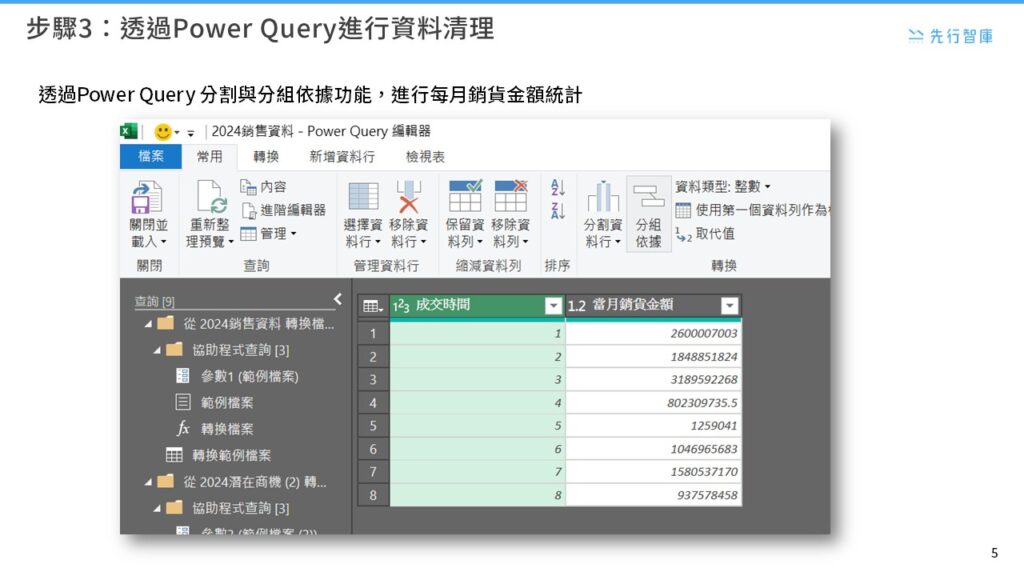
Step 3: Data Cleaning with Power Query
After merging the data, use Power Query’s Split Columns and Group By functions to organize the dataset:
- Remove unnecessary fields.
- Ensure critical data points (e.g., transaction time, sales amount) are correctly formatted.
- Use Group By to summarize monthly sales figures, preparing the dataset for performance analysis.
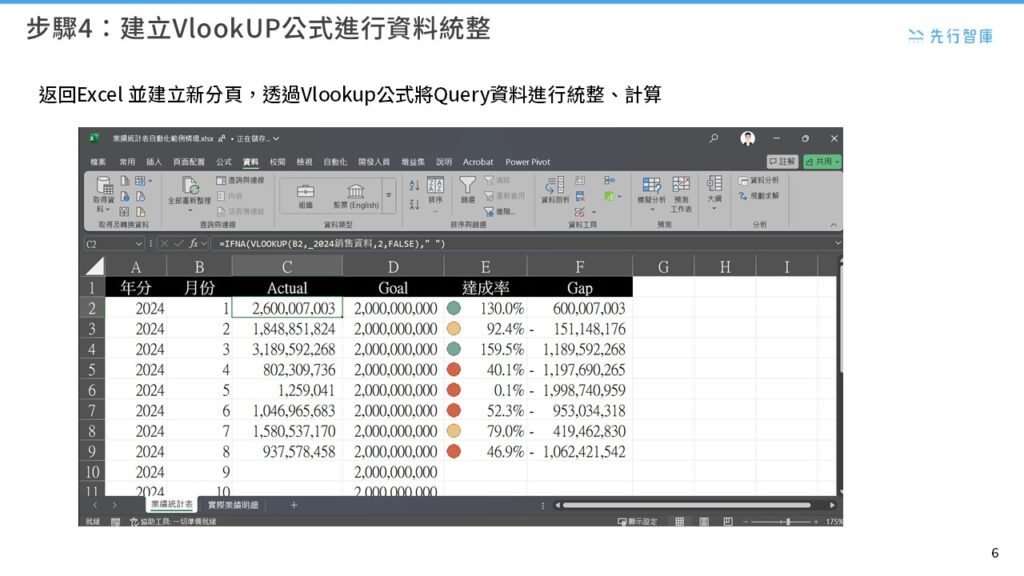
Step 4: Use VLOOKUP for Data Consolidation
After Power Query processes the data, return to Excel and create a new worksheet. Use the VLOOKUP function to integrate the cleaned data into the final report.
- Match actual sales figures (Actual) with target values (Goal) based on the month.
- Calculate achievement rates and performance gaps (Gap).
- Apply Conditional Formatting to highlight achievement rates, making insights clearer.
4、Conclusion
By leveraging Power Query, automating Excel reports becomes effortless and highly efficient. From integrating monthly data and cleaning formats to summarizing sales performance and using VLOOKUP for analysis, the entire workflow is fully automated—just refresh the report, and it updates instantly.
This approach minimizes human errors and ensures data consistency and accuracy, making it ideal for sales performance tracking, financial reports, and inventory management. Power Query transforms Excel from a simple data entry tool into a dynamic, real-time analytics platform, empowering businesses with precise and efficient decision-making.
Sign up now to attend our seminar!
Want to learn more about optimizing report processing with Power Query? Click the hyperlink above or the image below to sign up for our upcoming online seminar. Master more techniques and make Excel your powerful assistant at work!

KSCC is a management consulting company in Taiwan. Our services include corporate in-house training, consulting, and leadership management.For more information about our corporate services, please feel free to visit our website: https://kscthinktank.com.tw/custom-training/
